
People you can count on
Binghamton University students, faculty help each other with data science

Nancy Um, professor of art history, has everyone’s attention as she clicks through a website called Mapping Gothic France, which uses a database of 3D laser scans, images, texts and maps to explore the relationship of hundreds of examples of Gothic architecture in the 12th and 13th centuries in nascent France. It is a great example of how data can generate new knowledge and revitalize interest in the humanities, she says.
While this appears to be a typical lunchtime lecture — with PowerPoint and sandwiches — it’s actually called a Data Salon, and most of Um’s audience come from outside her department. There are engineers, mathematicians and computer scientists — people who, until recently, might not have ventured across campus to listen to an art historian. But now, because of data science, they are her colleagues.
At universities around the country, data science has spread far beyond its traditional homes in the mathematical sciences and computer science departments. Nearly every discipline has data waiting for discovery. At Binghamton University, the demand for training and scholarship has moved so fast that faculty, students and staff have begun grassroots efforts to build skills and share ideas.
The Data Salon is one example. It’s not a traditional departmental seminar; it’s a talk about a specific topic, followed by discussion that welcomes viewpoints from other disciplines, says Xingye Qiao, associate professor of mathematical sciences and an organizer of the Data Salon.
“It helps us understand where other people are coming from,” he says.
Since summer 2017, there have been 13 Data Salons covering topics ranging from “smart cities” to machine learning to geographical information systems to gerrymandering.
Surprisingly, gerrymandering proved to be a popular topic.
“It was a mix of statistical thinking, computer programming and a real problem,” Qiao says.
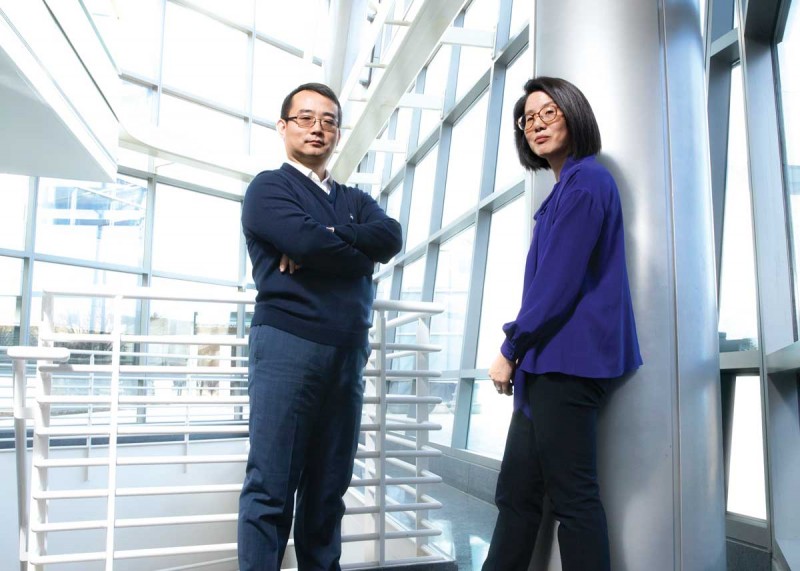
Qiao’s research focuses on statistical machine learning. Um’s specialty is Islamic art and architecture. Both are members of an approximately 18-member committee that has been working for the past few years to expand datascience programming at Binghamton University. The group hit a milestone last summer when it was officially recognized as the Data Science Transdisciplinary Area of Excellence (TAE), which is charged with establishing data-centered research across a variety of disciplines at Binghamton University. It is the sixth and newest TAE on campus; Qiao is its chair.
Qiao acknowledges that getting this far has required becoming comfortable with other ways of approaching scholarship. For example, not everyone knows statistics, so graduate students from math are offering statistical consulting to faculty and students on campus. It’s all about giving people who want to do data analysis the skills to get started. A workshop last year on scraping data from the web filled up fast.
“We try and take a very broad view and bring people together. It’s the only way as a new entity we can grow, to be more inclusive instead of saying, ‘You don’t belong here,’” he says.
Um says she’s never been on a committee with people from so many different schools. “It’s been a path of discovery among the group about how to talk to each other.”
Over the course of her career, Um has gone from looking at paintings with a magnifying glass to teaching students how to use software.
“In graduate school I was never shown a spreadsheet, never taught how to use a data frame or how to write code in Python,” she says.
Motivated by a movement called the digital humanities, which uses data science and myriad digital resources to mine new knowledge from classical humanistic disciplines, such as literature and philosophy, Um has spent summers learning new technology and software to wrangle, manage and visualize her data.
Yet, as she explains during her presentation, data science in the humanities can look very different from data science in the STEM disciplines.
For example, some scientists can readily tap computer-generated datasets to aid in their research, while a historian might start with a 17th-century manuscript from which certain information must be entered, by hand, into a spreadsheet or database. What to enter, how to enter it and what you are seeking to find out must all be decided ahead of time, as determined by the specific research questions being posed.
If your goal is to plot street addresses of sculptors in Paris in 1690, how will you provide exact geographical coordinates for approximations such as “across from the cathedral” and “next to the cheesemaker?”
“You always have to make choices,” she says. “Data is never neutral.”
Addressing issues that are particular to the humanities, Um says, is one of her commitments to the TAE group.
“We as humanists need to learn from people in math and computer science, and I’m learning every day. But I also think that people who are working at the technical end of data science have a lot to learn from the humanities about the social and human aspects of data,” she says.
Qiao agrees. Teaching a freshman seminar called Data Science and Us has been an adventure in exploring the human context and ethics of data science, he says.
“I think we who are on the technical end are less aware of the environment that the data comes from, and we tend to oversimplify subject matters by mathematical models. I now pay more attention to the human/societal side of the research, which has helped me a lot.”
Students dive into data
When she was a junior, Lydia King ’18 started a club. Or maybe it was a movement. She was pursuing a double major in math and economics but was missing some basic technical skills, and she knew she wasn’t alone.
“In Harpur College, we were hearing a lot about concepts and quantitative theory,” she says, “but we weren’t getting jobs.”
So, she founded the Data Science and Analytics Club for students who wanted to pick up skills such as Excel and some database languages but who lacked the time or comfort level to learn them in the classroom.
The pitch was that the skills would be taught by other students, and the tutorials would be free and easy. Initial interest was mostly from liberal arts majors.
“A lot of students who’ve been left out of the STEM fields have anxiety walking into those classrooms. They feel they don’t belong,” she says. And that can limit careers.
The club has proved popular. Membership this year is over 700 students, making it the largest club on campus by about 150 people.
“Our Python teacher is from computer science and our Excel teacher is from SOM,” says Robert Valdez, club president and senior mechanical engineering major.
Students learn at their own pace. Some attend every tutorial and then they’re done, while others take the same tutorial again and again because they continue to learn from it. There’s no exam, and there is lots of support.
Those who are teaching may have picked up their knowledge in a class, from an internship or even in high school. Some are self-taught. For many, the cross-disciplinary makeup of the club is a place to explore ideas and learn how to communicate them.
“A lot of the students don’t want to be so technical with computer science; they don’t want to sit there and just be coding all day. They want to do something more practical, more applicable,” Valdez says.
In March, 119 students participated in the club’s annual Datathon. Teams had 27 hours to complete a project based on a dataset.
“After teaching the skills, it’s our way of giving students a project they can put on their résumés,” Valdez says.
Organize, analyze, visualize
Identifying, collecting and processing data inevitably leads to the question: Now what? How will the data be presented so that it can inform decisions, prompt questions or offer new insights?
Data visualization is a means for sharing information. It can be as simple as an Excel spreadsheet or as artful as an infographic. But in the end, the data needs to say something, and it needs to be visually coherent.
Last summer, data research analyst Zoraya Cruz-Bonilla ’05, MPA ’17, and assessment analyst Kirsten Pagan, MA ’10, both with the office of Student Affairs Assessment and Strategic Initiatives, participated in the Binghamton University Libraries’ guest curator program. Their exhibit, called “Data Visualization: Contributions and Insights from the ‘Museum of Cognitive Art,’” shows the history and transformation of data visualization and addresses the challenges of presenting data in a manner that is unbiased, accurate, ethical and accessible. It is across from the main desk of the Bartle Library through May.
There are facets to data visualization that people don’t consider, Cruz-Bonilla says. “There is the hardcore, data analysis part and the artistic part, and it’s not one-size-fits-all.”
The exhibit was followed by three data visualization workshops, open to anyone on campus. Cruz-Bonilla taught “Designing an Infographic” in December. She used open-source data to give attendees some hands-on practice.
The aim of the workshops is to build confidence in those attending, she says.
“It might be easy to build a survey, but interpreting the data can be intimidating. How do you make sense out of it? We want to make sure people have the confidence to look at the data, digest it and put it into an easy format.”