High water mark: Knuepfer to track changes along Lake Ontario’s shore

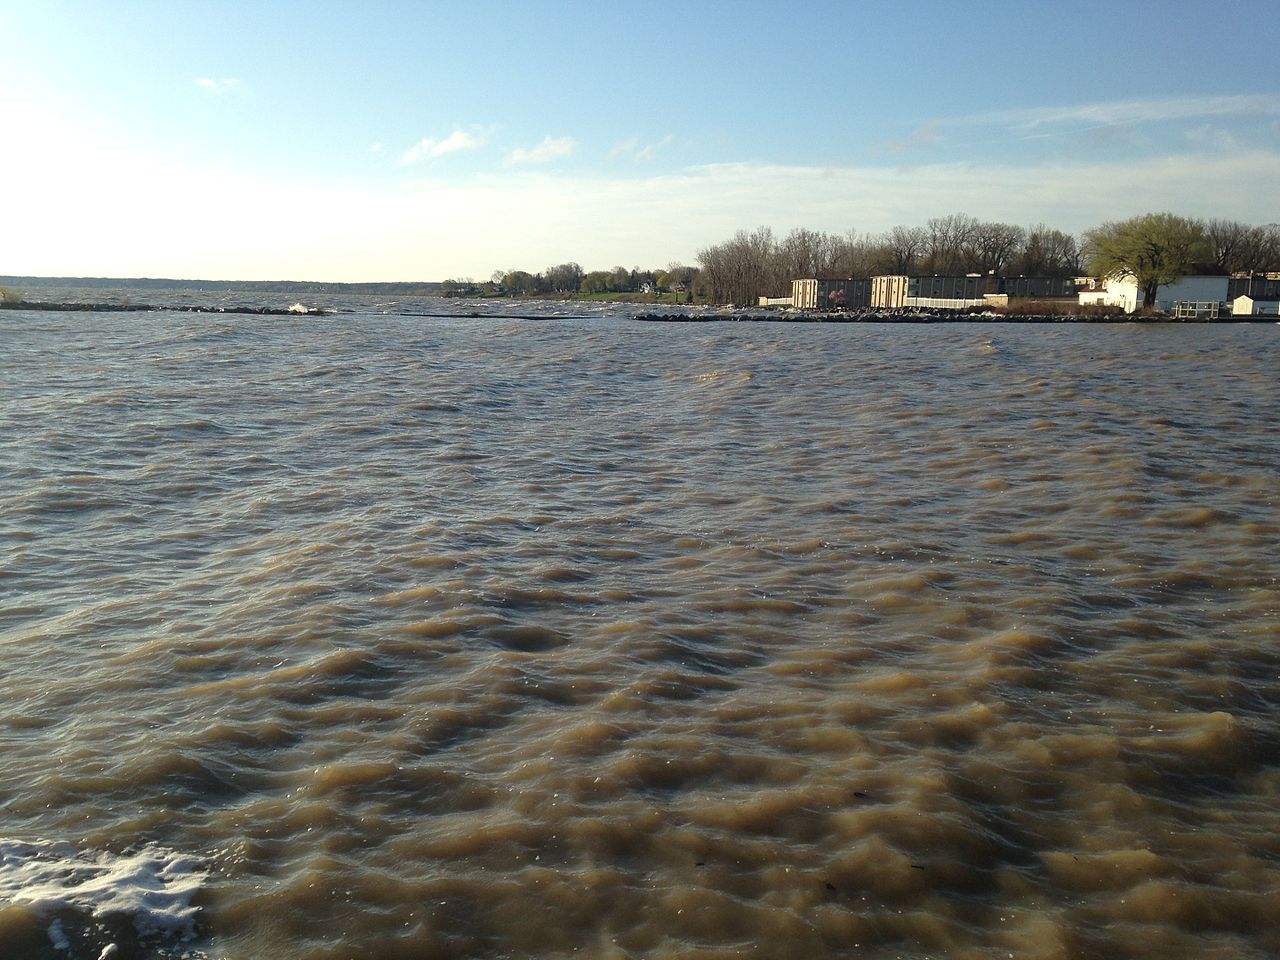
The waters swelled in Lake Ontario in 2017 and 2019, gouging properties and bringing the shoreline perilously close to houses in Niagara and Orleans counties.
The region is no stranger to erosion: Associate Professor of Geological Sciences and Environmental Studies Peter L. K. Knuepfer often brings students on field trips to the lake, where they visit rapidly retreating bluffs first noted in a 1970’s study by a University at Buffalo professor.
“There has been a lot of erosion in recent years along the coastal areas of Lake Ontario,” Knuepfer said.
But is that erosion steady or accelerating? Knuepfer doesn’t know — yet.
He recently received a $24,035 grant from the New York State Department of Environmental Conservation (DEC) and Syracuse-based Great Lakes Research Consortium to augment New York State’s Geographic Information System (GIS) database with an historical record of Lake Ontario’s coastline changes in the two counties.
The project’s findings will offer insight into the two most recent high-water events, as well as possible future changes — information that could prove critical for municipal and county officials in the region.
Tracing change
The Great Lakes system has seen increased rainfall in recent years, but that’s not the only potential contributor to erosion. Around seven years ago, the international joint commission overseeing the water in Lake Ontario and the St. Lawrence River changed the way they control water levels to minimize the potential for downstream flooding around Montreal. They’re now holding more water back through the dam system, affecting both the upper portion of the river and the lake.
“In order to really understand how unusual the high-water levels have been, as a geologist I like to look back through time,” Knuepfer said.
With the grant funds, he and geological sciences master’s student Matthew Cameron will begin looking at Western New York, where the 1970’s study established some of the highest rates of erosion; these areas were also hard-hit by the recent high-water events.
The 1970’s researchers had access to several generations of aerial photographs and used the techniques of the day to compute rates of erosion at selected locations. Knuepfer will use these and other aerial photographs, as well as topographic maps that date back to the early 20th century and navigational charts going back to the late 19th century. Putting together information over a wide span of time will then allow them to compute the rate of shoreline change.
Unlike the 1970s, geoscientists today have digital tools to make the task easier. Using software, they can overlay multiple generations of imagery to map out the shoreline over a period of time — a painful and painstaking task 40 years ago, in the early days of computers.
Entering the data into the GIS system will still be a lengthy endeavor, Cameron acknowledged. The records first need to be digitized, and then the process of geo-referencing and geo-rectifying begins, matching locations using roads and other landmarks, and correcting errors. To prepare for the project, he’s been reading news reports covering the most recent spates of high-water damage, as well as reacquainting himself with GIS.
Knuepfer and Cameron will compile data and begin the computer analysis this summer, and the project will continue over the next year. They also plan to field-verify their observations, and will head out to the shoreline later this summer and possibly next spring.
Along the way, the project will include significant outreach to affected communities, both to gain access to research locations and gather data about residents’ experiences there. Knuepfer and Cameron also plan to share the data they gather with local governments.
“Being able to do this research and come up with a complete study of how the shoreline is shifting is going to help the local community,” Cameron said. “They’re doing so much work on restoration projects there; having this data would really be valuable.”