Mapping Binghamton: GIS Day showcases the versatility of high-tech maps
10th annual event showcases student and faculty research, practical applications and more
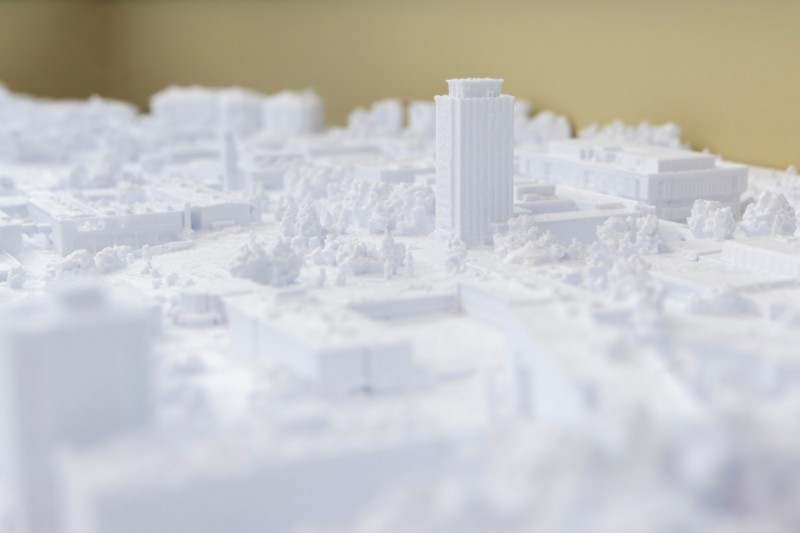

The Library Tower and the Couper Administration Building, Fine Arts and the Science buildings: A Binghamton University campus in miniature rose from a slab of 3-D printed plastic in painstaking detail, down to the last tree.
With the help of Associate Geography Professor Thomas Pingel, environmental studies major Gianna Mango ’25 created it during the spring 2024 semester, using drone-mounted lidar, software and many hours on a 3-D printer. The map was just one of the many projects on display at the Geography Department’s 10th annual GIS Day, held on Nov. 21.
The geography major has a GIS track, and a GIS minor is also available. Known today as Geographic Information Science, GIS has moved beyond specialized software to a field of study in its own right, Pingel said. And maps themselves are more than just scale renderings of landscapes or street grids. Coupled with remote sensing technologies, they can offer a detailed view of, say, the health of vegetation in the Binghamton University Nature Preserve.
“GIS Day is a way to celebrate all these different aspects,” Pingel said.
Student-created maps on display tackled a wide range of topics, including the expansion of developed land in Rockland County from 2001-2009. Poland’s changing national borders. Religious diversity in the City of Binghamton. Leadership longevity in Africa. The prevalence of invasive Japanese knotweed in New York state. Favorite candy by state. (New Yorkers prefer KitKat.) Nuthatch Hollow’s trail system, the off-trail shortcuts Binghamton students take across campus, and planning for Binghamton’s pickleball future. Three-dimensional topographic maps of New York state and renderings of hurricane clouds.
“We’re a small department, and it’s great to see everyone’s work,” said Lily Burstein, a senior geography major, as she perused the map display in the Old Champlain Atrium.
She’s working to complete interior mapping of campus buildings, which will someday help future Binghamton students navigate the labyrinth of labs and classroom spaces. How about the dreaded Library basement?
“Everyone asks me about that,” she said. “I’m waiting on the CAD (computer-assisted design) data.”
Jax Kobey, a sophomore majoring in geography and urban planning, had two maps on display: Broome County Transit’s weekday service map and racial disparities in schools located in Montgomery County, Maryland, where they grew up.
“There’s so much you can do with mapping and spatial analysis,” they said.
GIS at Binghamton
Even the event check-in fed into an online dashboard of real-time data, expressed in charts: 73% of attendees were undergraduate students and 15% were graduate students. Most attendees live off-campus, and 5.3% consider themselves experts at GIS.
“I put down ‘intermediate’ for myself,” joked Kevin Heard, associate director of the GIS Campus Core Facility and the event chair.
More than 200 Binghamton students downloaded ArcPro onto their computers last semester, although desktop use is decreasing due to the rise of online applications, such as ArcGIS Online; the latter has drawn more than 3,000 users on campus over the past three years.
The use of GIS technology as a classroom tool has increased over the years, including not only geography, but anthropology, biology, economics, history, political science and more. Some popular geography GIS courses have a waiting list, Heard said.
Students in the First-year Research Immersion (FRI) program’s Environmental Visualization stream are introduced to a variety of GIS techniques, explained Research Assistant Professor Joe Panzik. A geophysicist specializing in paleomagnetism, Panzik’s own research combines laboratory, field and computational work; mapping plays a key role.
“Our lab is chaotic. I have some students working on projects in anthropology; others are looking at marine stuff or working on geoscience accessibility. They’re all over the place, but focused on the environment as a whole,” he explained.
Students have used handheld GPS units to map hemlocks in the Nature Preserve that are infested with woolly adelgids. Last year, FRI students went to Salt Springs State Park in Pennsylvania in an attempt to detect abandoned methane wells; they compared results from a commercial magnetometer to the one in their cellphones, using the data to create maps. Another team remapped all the trails in the Nature Preserve using handheld GPS and lidar units, resulting in more accurate trail maps.
During a round of lightning talks, researchers and working professionals described how they use mapping technology.
Assistant Professor of Africana Studies and Global Public Health Cordelia Martin-Ikpe describes herself as a health geographer. One of her recent projects consisted of a social-spatial examination of chronic disease prevalence within New York City community districts.
“I set out to investigate which districts have higher disease rates than expected, even after adjusting for socio-economic position, or SEP,” she said. “A higher SEP is generally associated with lower disease prevalence.”
However, some districts — Queens Village, East Flatbush and Coney Island — had higher than expected rates, suggesting other confounding factors such as healthcare access or environmental toxins. Martin-Ikpe used Arc Studio to streamline her data process: merging socioeconomic and health data, cleaning and filtering it, and ultimately building models, she said.
A miniature campus
Pingel and Mango explained the process involved in creating a 3-D rendering of campus during their lightning talk.
“A lot of our experience with maps is mediated by technology — a lot of it digital, some of it analog. What 3-D printed maps do is let us visualize things in a way we can touch and feel,” Pingel said.
The technology has applications for accessibility; tactile maps allow people with visual impairments to learn about their environment, for example.
The technology itself is accessible in other ways: files for printing 3-D maps are available online, and anyone can download them. Web apps also exist that allow you to create custom maps, which you can then download and send to a 3-D printer; on campus, 3-D printers are available in the Emerging Technology Studio in the Technology Hub and the Libraries’ Maker Lab. Faculty, staff and students can use both facilities for free.
Specialized jobs may require more steps. If you’re looking to create a highly detailed map of a city, for example, you may want to start with lidar data, which is available from the National Oceanic and Atmospheric Administration (NOAA). Open-source GIS software such as QGIS can turn that data into a printable file. That data, however, can have limitations; for one, lidar doesn’t work over bodies of water.
“When you zoom into a place like campus, which is what we were after, it’s not detailed enough,” Pingel said. “You can see the Library Tower ends up kind of mushy, and the trees aren’t shaped right. What works at one scale doesn’t work at another, which is a fundamental issue in geography.”
To create a detailed model of campus, Pingel collected data via a drone with a lidar unit, which took around an hour; then, software transformed the data into a 3-D representation known as a mesh. A mesh, however, doesn’t have the volume needed for 3-D printing; that took a dissolve operation, in which the map was collapsed into a single structure. Then, it was a matter of adding volume to create an object capable of being printed.
The map was printed in 15 different pieces, each of which took six to 15 hours to print, Mango said; she then soldered them together to create a single, plain-white piece. While color 3-D printers are available, a white map can be used with a projector to overlay images on its surface, Pingel said.
“You notice things that you wouldn’t have noticed before,” he said. “I also find (3-D maps) very collaborative; you can get a lot of people to gather round, talk about it and point at things.”
Other speakers during the event included Stephanie Brewer, chief planner for the Broome County Department of Planning and Economic Development; Zach Staff, the New York/Mid-Atlantic Regional Aviation director for McFarland Johnson, Inc.; Assistant Professor of the Watson School of Computing Yingxue Zhang; Digital and Data Studies instructor Melissa Haller; and geography graduate students Md. Awual Baksh and Alana McKeon.
Not every attendee was well-versed in the technology; some undergraduates, such as sophomore Anu Ojeyemi, came to explore the possibilities. A dual major in environmental science and economics, he’s currently taking Geography 360, which introduces students to GIS and cartography.
“I don’t have research of my own just yet, but it might be interesting to think about,” he said.