Binghamton computer science student builds website to track COVID-19 in India
Undergrad from Bahrain centralizes data for country of 1.35 billion

In the midst of the global pandemic, Jeremy Philemon is helping India keep track of COVID-19 infection rates.
Philemon is a 2+2 computer science student splitting his education between the Vellore Institute of Technology in India and Binghamton University’s Thomas J. Watson School of Engineering and Applied Science. He’s applied his skills in the creation and updating of covid19india.org, a website that aggregates data from every district in the country of 1.35 billion people. It has received more than 1.75 billion page visits since early March.
In a recent interview, Philemon explained his role in the project, how the website runs without any funding and how this experience might inform his future.
Q: When did you start working on the COVID-19 India tracker, and how did you come up with the idea?
A: It was around the second week of March. I was in Bahrain with my family, and we were already a month in from the island’s first positive case. It was terrifying at first; however, after a few weeks of staying at home, things were starting to look OK. Unfortunately, that wasn’t the case for a lot of other countries at that time. Numbers around the world had started increasing at an alarming rate, and India was free from the virus for almost a month until that week.
India saw a sudden jump in the number of positive cases, and it concerned a lot of people, including me. Initially, there were posts on Reddit’s r/India discussion board on the lack of reporting about the virus to the general public. Contact tracing was something that was already being undertaken by many countries, but it didn’t seem like India’s policymakers were transparent enough with their methods/efforts to keep the public informed.
Furthermore, it was discussed that for any country to battle the virus, access to reliable data presented with clarity and in good faith was crucial. Not only for policymakers and researchers but ordinary people doing everyday things like going to the supermarket or visiting their loved ones. Virtually everyone was vulnerable, so ideally, information needed to be made accessible to everyone in one common platform.
Secondly, information released by the authorities also lacked in terms of centralization. At some point, even though they had put out the data, it had become almost inaccessible to people. Each of the 28 states and eight union territories had their separate channels of communication and reporting, each of them with varying degrees of granularity. It got a lot harder for an average person or even a data scientist to get hold of all the information in one place.
So someone needed to take up that responsibility. And after messaging a few people around, I was able to get in touch with a small team that was already making good progress with data collection. They used state-released bulletins and reliable news sources reporting on behalf of medical institutions to record every positive case meticulously with as much relevant data as they could obtain (excluding personally identifiable information, of course).
In the process, they were able to build a rich dataset and made it publicly open for anyone. In its initial stage, we were also able to visualize a network graph that gave a neat summary of how the transmissions had taken place.
Since we were mapping every confirmed case, we also happened to have the “right” numbers for the demographics of those tested positive, medically treated, recovered or deceased. We could present that data and developed a “tracker” that would update as the database was being worked on and report up-to-date numbers. And that got a lot of things rolling later on.
Q: What is your involvement with the project?
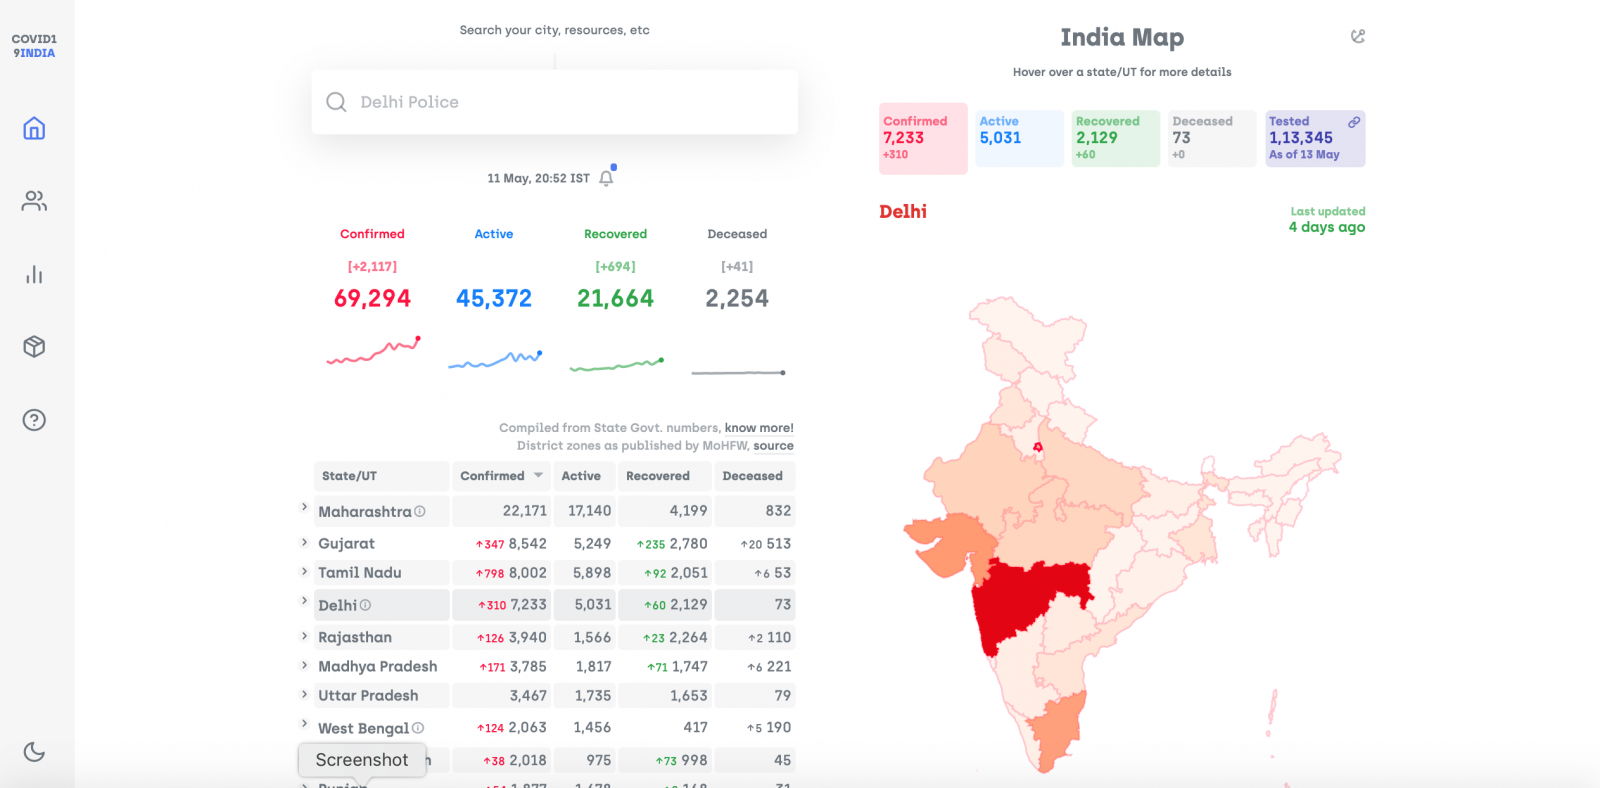
A: I’ve been maintaining the covid19india.org website since its initial push to production. It started as a simple webpage showing the numbers broken down state by state, a choropleth map and a set of time-series charts. However, in just a few days, we were able to push a lot of significant updates in terms of functionality and accessibility to the website. Useful features include district-level granularity in reporting, the ability to search for the nearest essential services and a demographic overview of the affected population.
We had also open-sourced the website on GitHub since the very beginning. As a result, we’ve had an overwhelming response from the open-source community to help us patch bugs and to introduce new features and improvements to the codebase.
GitHub had also mentioned us in one of its blog posts talking about open collaboration efforts around the world.
Q: Who is your intended audience for this data collection?
A: Potentially anyone who would like to have a look at it and make smarter decisions. Apart from the ordinary people using it to be aware of the current situation of the country, we’ve had a few states’ task forces also monitoring the website to keep up with their reports. We’ve also had researchers and data analysts working on the dataset to figure out where we might be headed in the coming days.
At present, there are a lot of people who can potentially work on this data and use it responsibly to understand patterns and draft new policies that could avert/reduce more spread. From an archival point of view, since we’ve documented the spread from the very start with so much detail, this could also be useful in looking back and reevaluating our approach and strategies in the future after the pandemic has passed.
Q: Why is it important, especially in a time of unprecedented crisis like this, to have publicly accessible and accurate data?
A: Every individual’s actions count toward determining the future of this virus in the country and across the world, and we made it our priority that this information should be made easily accessible to everyone in India. Doing so would help them make smarter decisions to keep themselves and those around them safe during this unfortunate time.
The importance of accurate reporting became apparent when the website, for a short time, had incorrectly put a positive case in the wrong district. Instead of Jajpur, the team had put them under Jaipur. After resolving it in a matter of a few minutes, we had people tweeting at us to revert it because everyone around Jajpur had come out and hit the streets again since they did not have any positive cases anymore. At that point, it was pretty evident that people do check the numbers and exercise extra caution when their region has reported a positive case.
Bahrain was able to test over 2,300 people in just its first few days of contact tracing. They were also able to figure out a good number of people who might have contracted the virus very early on. Their ability to report their methods and findings transparently to the public not only helped them in their cause, but it also calmed people down to cooperate with the authorities during the first few weeks of testing — a crucial time for any country to contain the spread.
Keeping citizens informed responsibly really does help in the fight. I can personally vouch for the sense of safety and reassurance that it gave my family and me during that time.
Q: How much active maintenance does the site require?
A: I’ve been working full time on keeping both the codebase and the website in good health over the past two months. We’ve had over 1.75 billion page visits, so keeping the website small, easily accessible on slower network speeds and compatible on almost all devices across different browsers has been quite challenging. I’ve never had to profile a website to optimize overheads in component render times, but this project has made me dive into a lot of new and complex things I’ve never dealt with before.
Apart from that, I’ve had to review issues and pull requests raised on our GitHub repository. In just a month and a half, we’ve received over 2,000 of them. So that’s been quite the ride as well.
On the data side, a lot of validation takes place behind the scenes every time the data team receives numbers from state bulletins and reconciles them against their respective districts. Sometimes the bulletins would require to be translated. Sometimes cases would move across districts/states, changing the counts and resulting in a trickier situation for the team to move them around as well. And sometimes we would not receive the state bulletins at all.
But given the amount of energy it takes for me to pull off just a few all-nighters, it has made me incredibly appreciative of and thankful for all the medical and essential workers out there constantly working day and night shifts saving and supporting countless lives during this challenging time. They deserve so much love and kindness for everything they’ve done and are continuing to do.
Q: How do you assess the institutional response to the virus in India?
A: It’s a big country with different states employing different strategies to combat the situation. Some state governments are carrying out extensive testing efforts, some are ensuring that low-income households are receiving appropriate care and some are enforcing stricter social distancing protocols. Recently, the central government announced an effort to bring home 14,800 stranded Indians from 12 countries.
On the other hand, some of the responses have incited controversy. The central government imposed a nationwide lockdown effective immediately without allowing a reasonable amount of time for people to prepare. It resulted in a large number of migrant workers getting stranded all over the country across state borders, leaving them in poor living conditions.
While I’m not currently residing in India, I cannot make an accurate judgment about their responses on a personal account. However, from what I’ve heard from my family and friends, the responses have been both uplifting and underwhelming.
Q: How long do you plan on keeping this site running? Do you have an endpoint?
A: We haven’t thought so much into the future. We live a day at a time and hope the pandemic passes soon.
Q: What are your biggest takeaways from this project? What do you plan to bring from this to whatever you have planned in the future?
A: I am fortunate to be part of a fantastic team. Together we were able to hack neat solutions. We’ve never had to spend even a dollar on deploying to an audience of over a billion people and enabling collaborations between hundreds of volunteers helping with data entry every day. It still blows my mind.
Also, since I was present throughout the process of creating something impactful from scratch, it has made me want to consider experimenting with product design in the future. I’ve had both fun and exhausting hours of development during the decision-making on features, accessibility and design. It’s been quite an enlightening experience whenever I had to spend a reasonable amount of time researching about visualizations and attempts at humanizing them.
For instance, seeing a lot of numbers could be desensitizing and, frankly, overwhelming to people. A simple decision between choosing which graphs to show, phrasing a sentence differently, and using mild color palettes could significantly help people to empathize and see through the numbers.
So, making decisions along those lines has been educational, and I’m looking forward to seeing where that would take me next.